City and County of Denver, CO Workforce
Sidwell
August 4, 2021

State of Colorado Workforce
The following maps are interactive! Click on features in the map to access additional demographic data, charts, and graphs. There are also map action buttons within the narrative text that you may click on to change the data shown in the map frame.
State of Colorado Workforce
From our inspired creatives to our driven innovators, Colorado’s talented and dynamic workforce is second to none.

Colorado continually tops the charts for job and economy growth, as well as being recognized as one of the best places in the nation to do business. On top of that, Colorado is known as much for its booming business climate as its superior lifestyle. What’s the secret to our success? A talented and dynamic workforce.
Ranked as the best in the nation, our labor pool is essential to the innovation and drive that our state’s economy benefits from. With a median age of 36.5, numerous high-performance education and research institutions, and a plethora of job training support organizations, Colorado’s workforce allows resident employers to create, grow and compete in a global economy.
Source: Colorado Office of Economic Development and International Trade
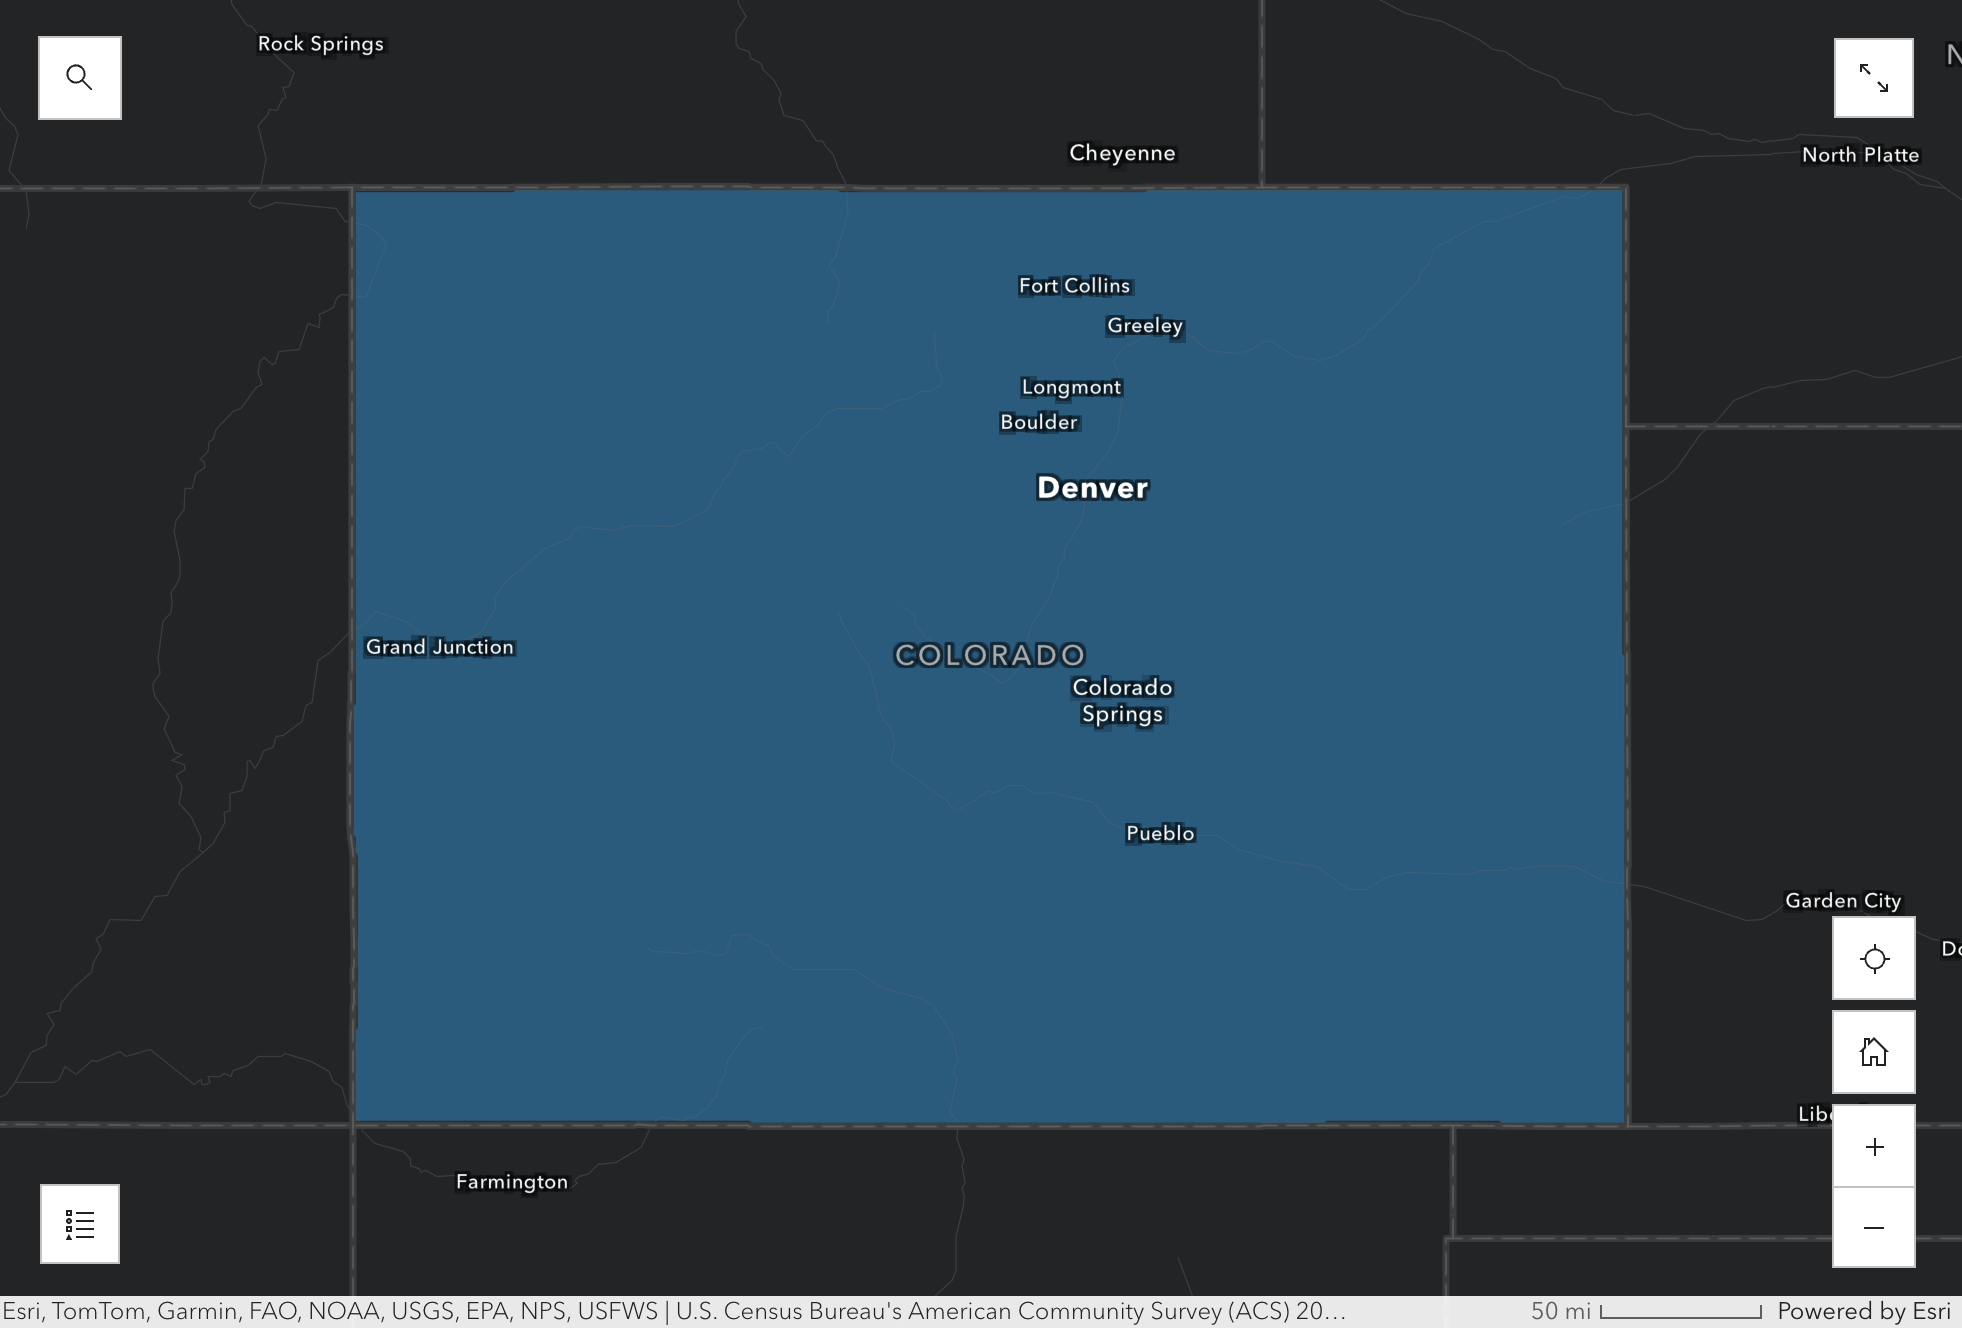
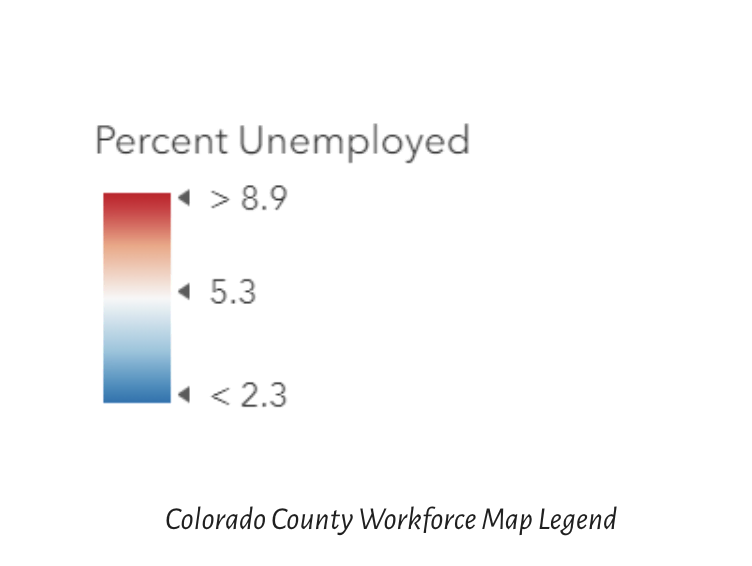
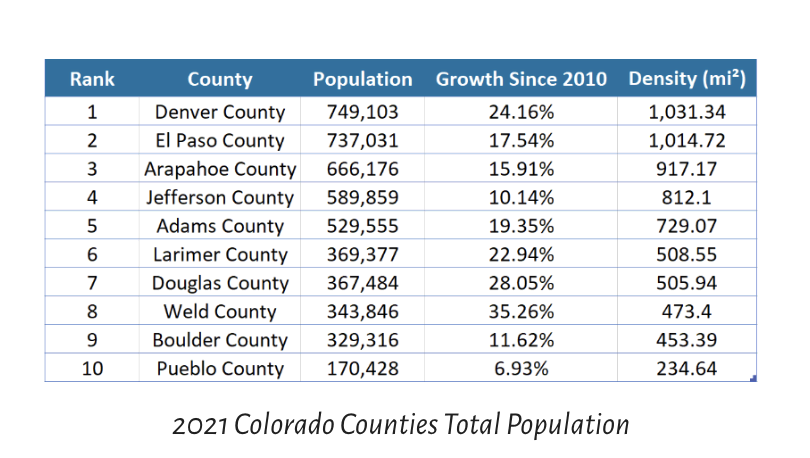
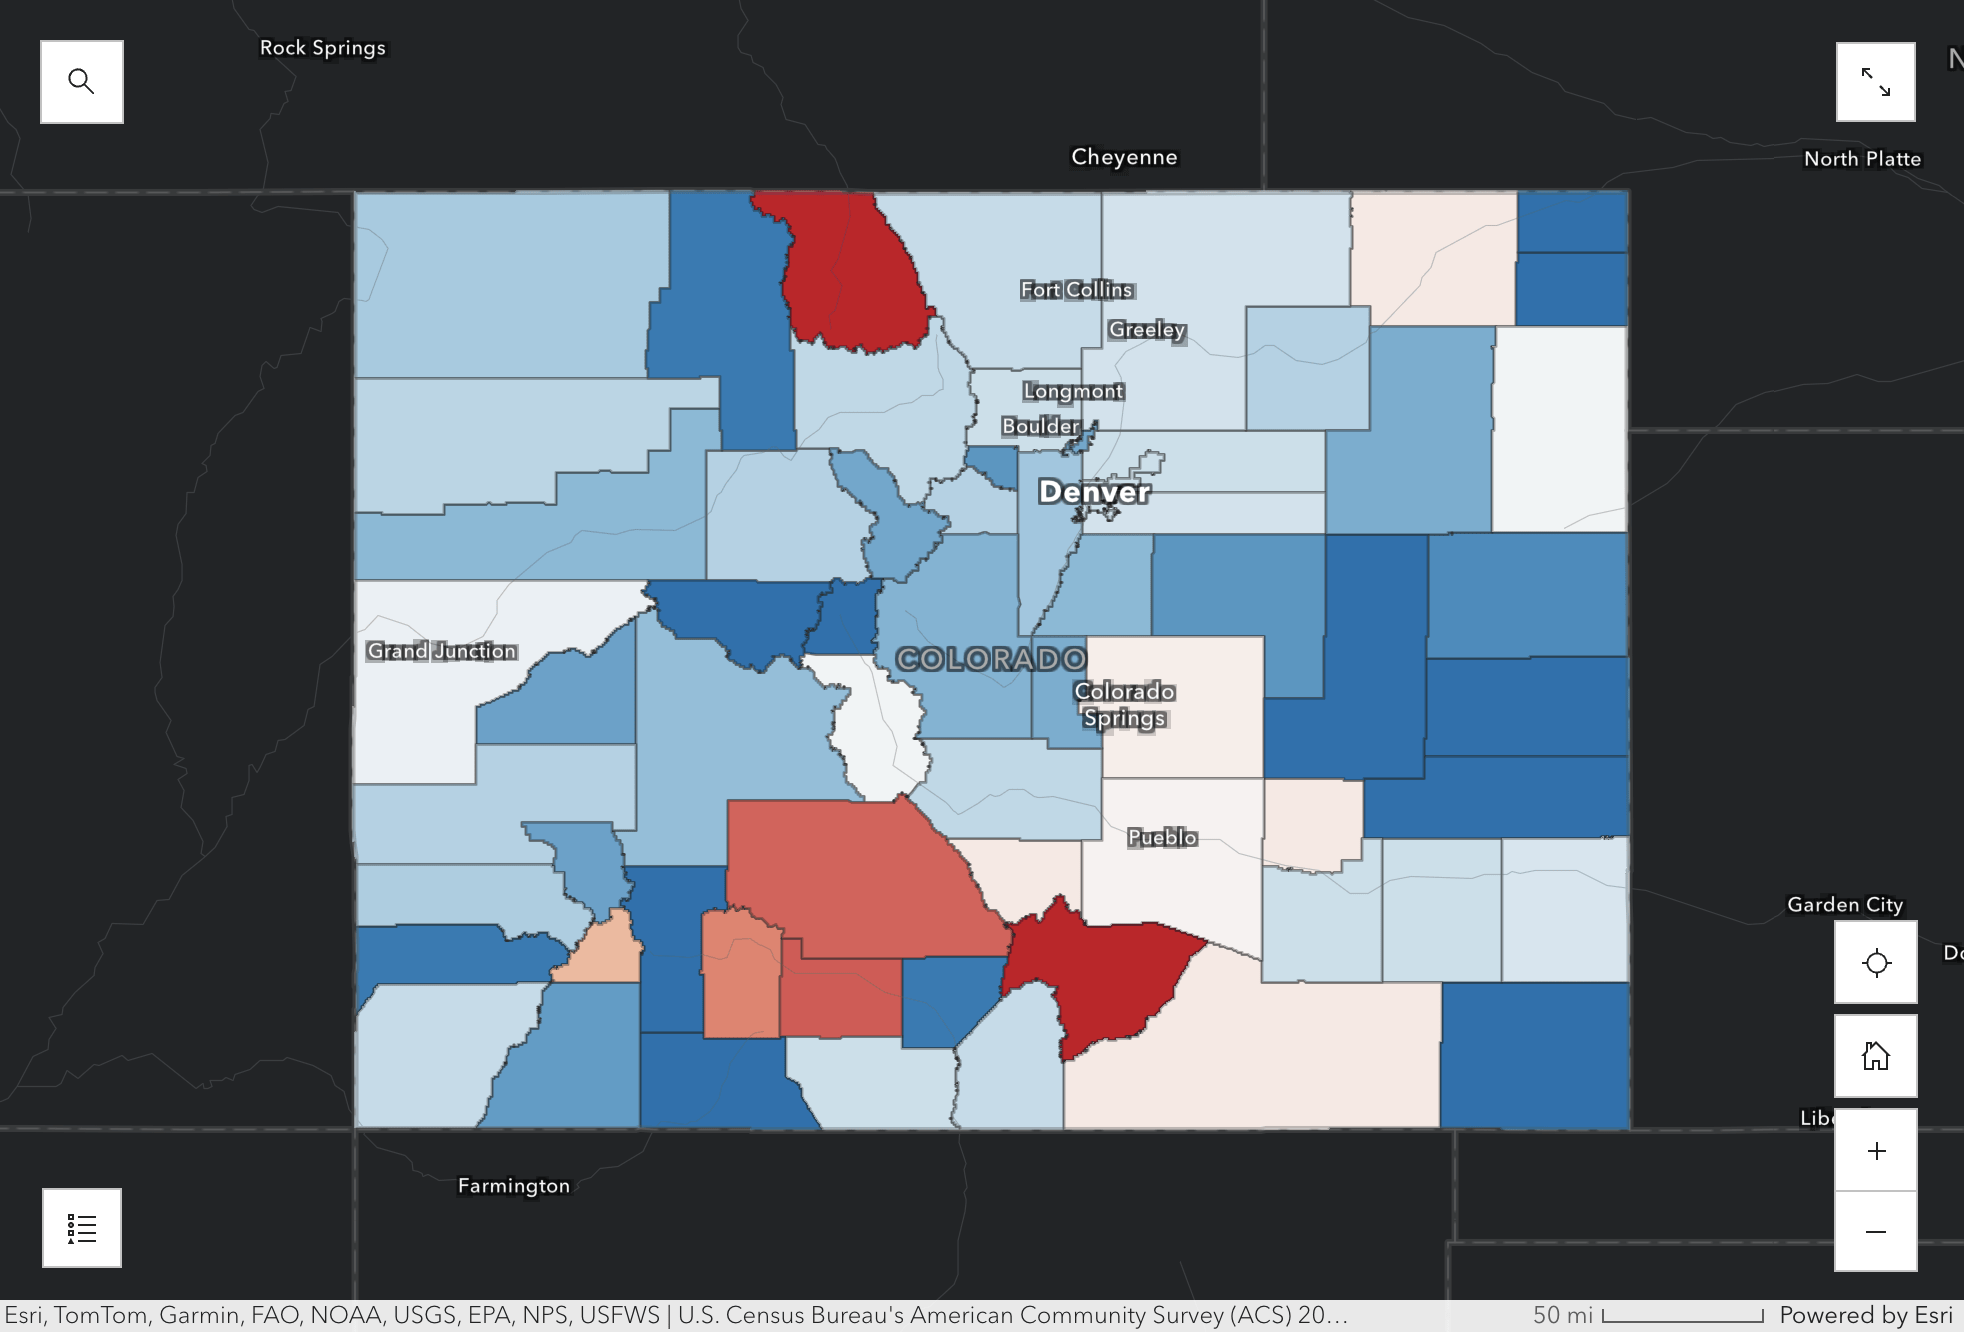
Colorado County Workforce
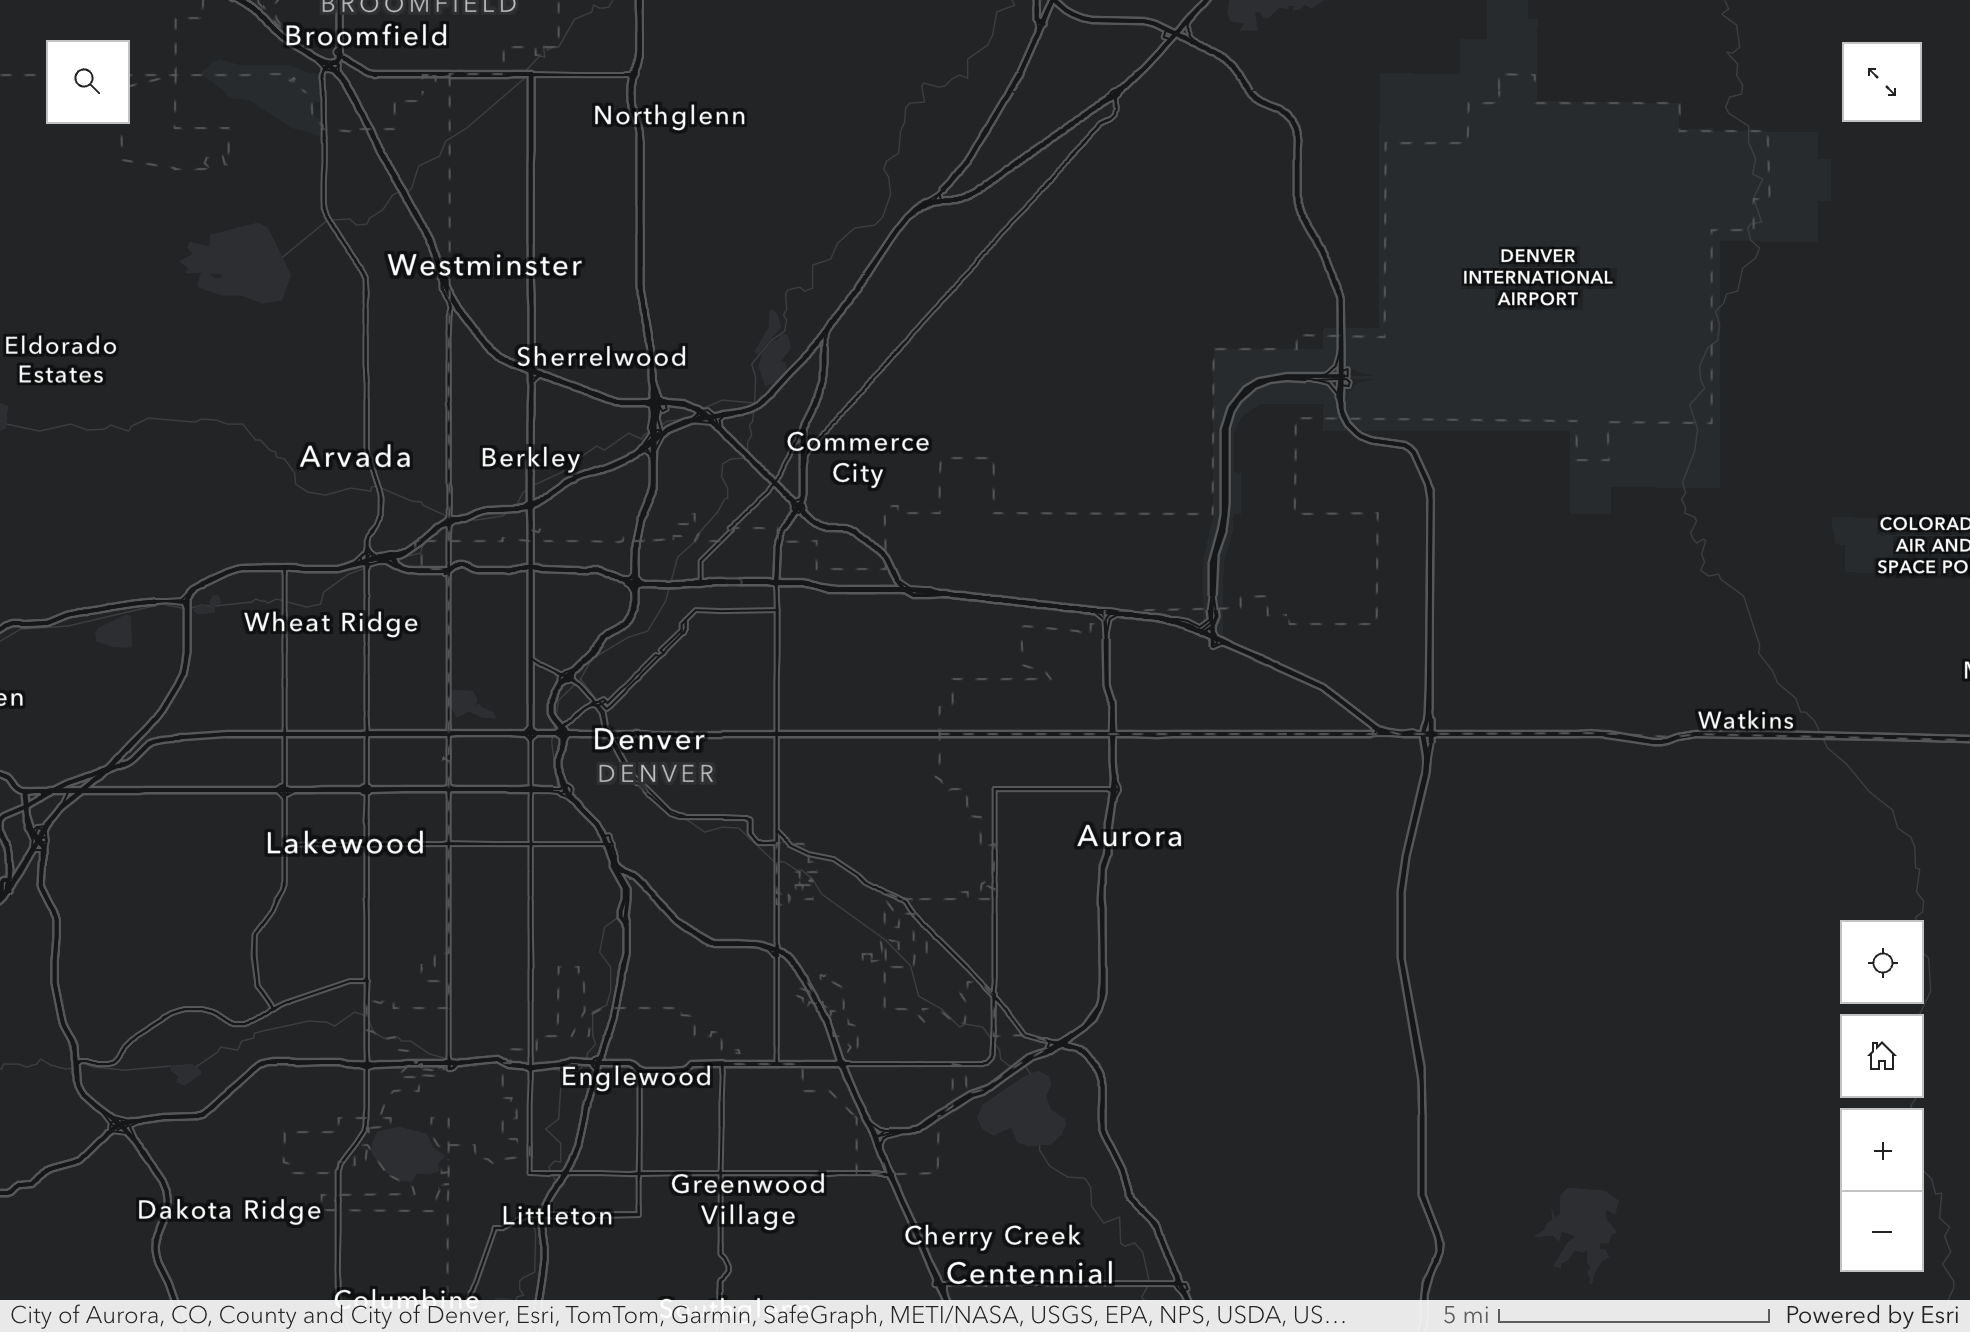
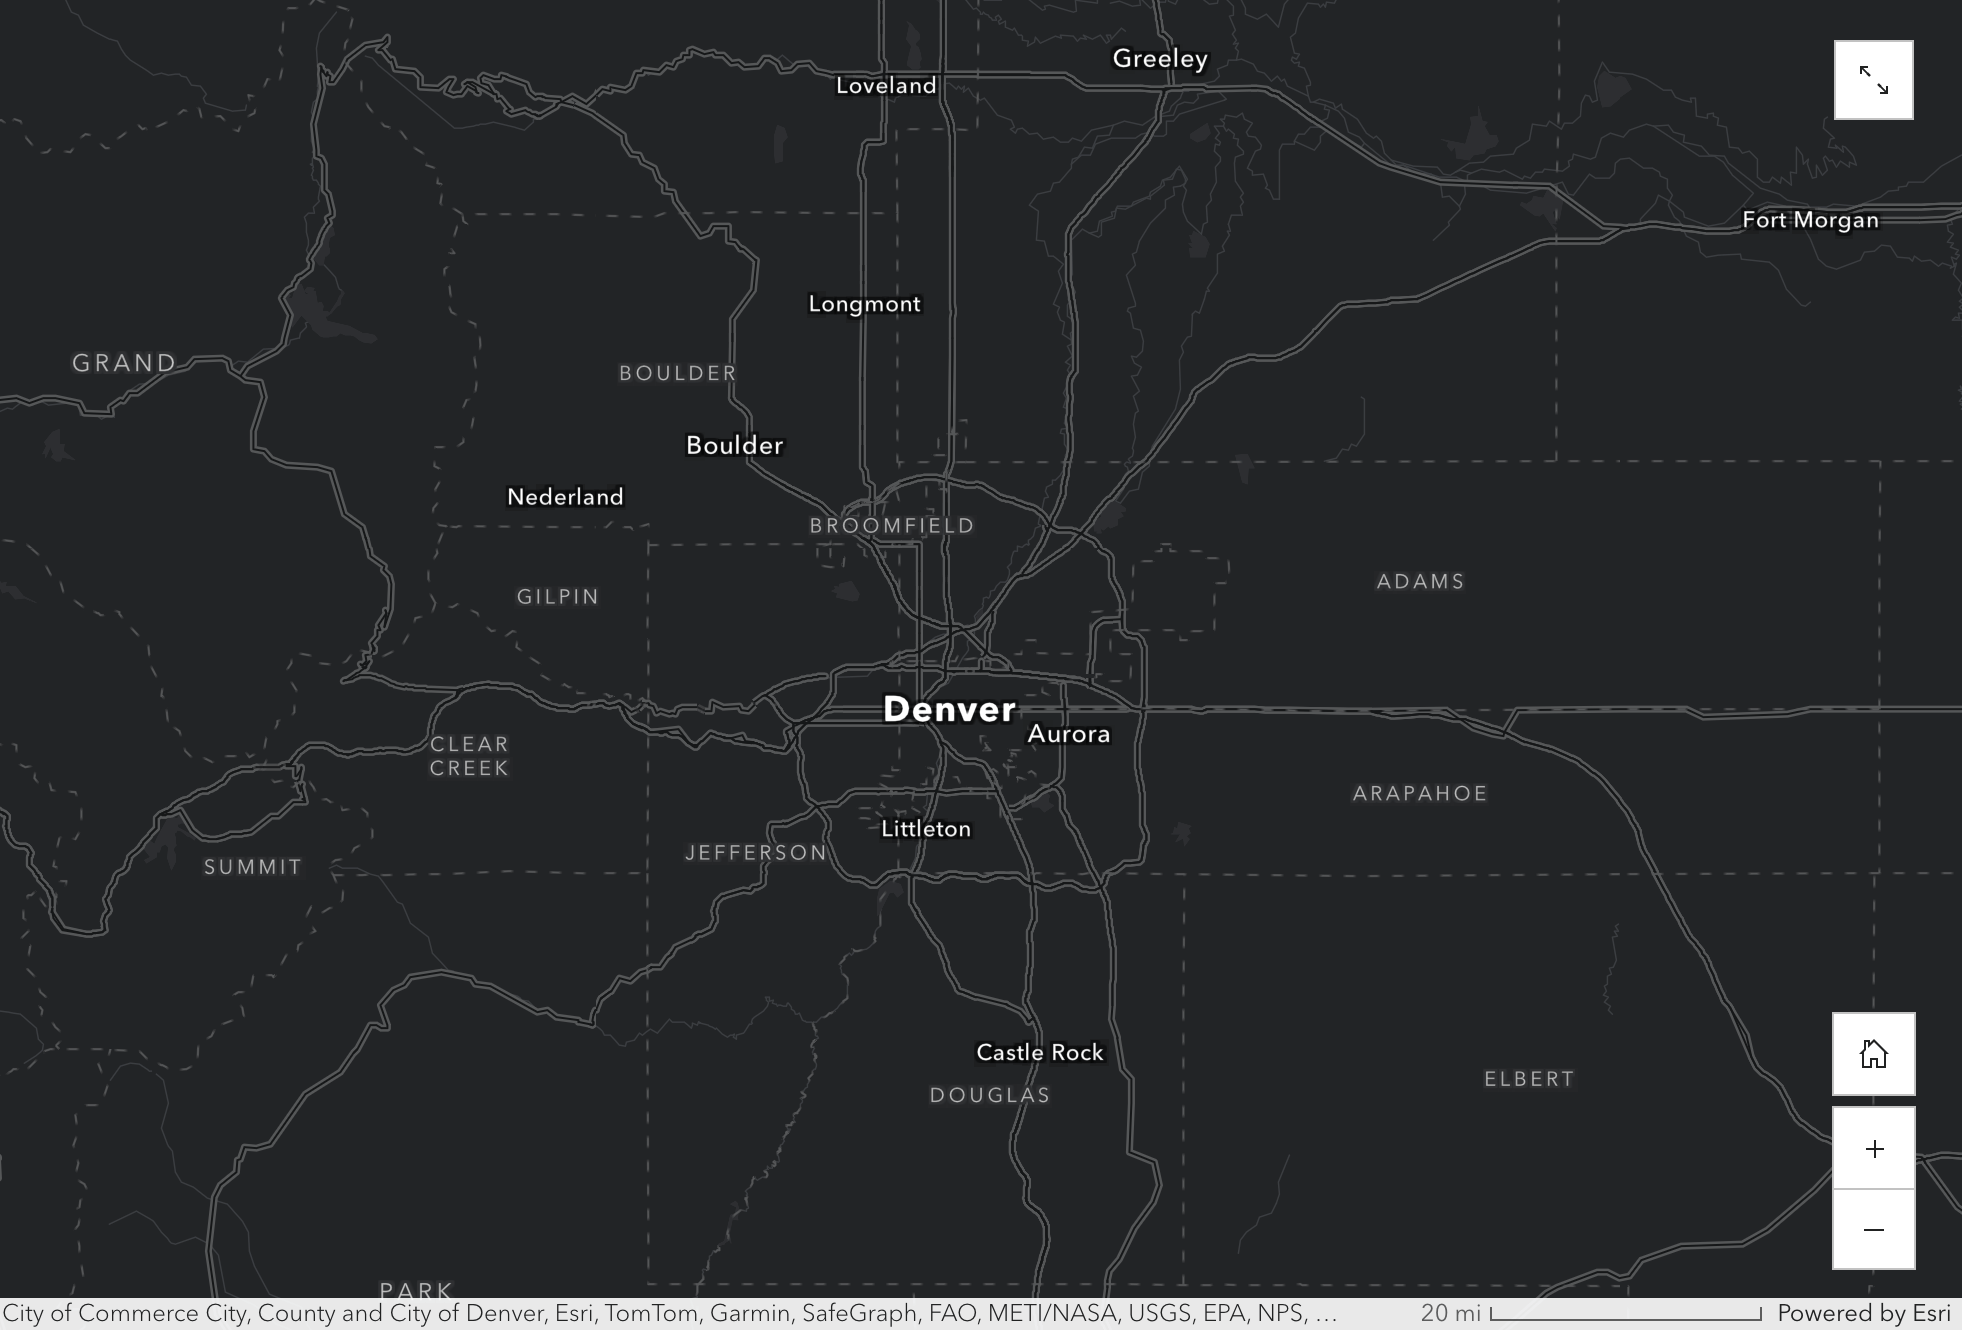
The state of Colorado is divided into 64 counties, of which, Denver County is the most populous.
Denver County is unique in that it only has one municipality, which is the City of Denver. Overall, the state of Colorado has an unemployment rate of 4.3%, which is below the U.S. National Average.
Census Tract Demographics
Age Characteristics
Click on the map action buttons below to view different facets of age by census tract in Denver County. Use the legend icon in the bottom left-hand corner of the map to view what the colored variables represent.Median AgeSilent Generation (Born 1945 and Before)Baby Boomers (Born 1946 to 1964)Generation X (Born 1965 to 1980)Millennials (Born 1981 to 1998)Generation Z (Born 1999 to 2016)Generation Alpha (Born 2017 and After)
Highest Educational Attainment Characteristics
Click on the map action buttons below to view different facets of educational attainment by census tract in Denver County. Use the legend icon in the bottom left-hand corner of the map to view what the colored variables represent.Graduate/Professional DegreeBachelor’s DegreeAssociate’s DegreeSome College/No DegreeGEDHigh School Diploma
Business and Industry Characteristics
Click on the map action buttons below to view different facets of business and industries by census tract in Denver County. Use the legend icon in the bottom left-hand corner of the map to view what the colored variables represent.Civilian Labor Force Population 16+Unemployment RateNumber of Businesses
Workforce Drive-Time Analytics
Labor Shed Analysis by Drive Time
The map to the right depicts 15, 30, and 45 minute drive time clouds to show labor shed reach for the City of Denver.
To view workforce characteristics per drive-time cloud, click on the links below:
Labor Force Infographic
Open live content in a new tab
https://bao.arcgis.com/InfographicsPlayer/BAMobile/9.2/reportPlayer/InfographicFromResource.html#resourceUrl=https://www.arcgis.com/sharing/rest/content/items/4ecc7ff80cd44dbc89e158fcd80ebd55/resources/f3b1c02052ce45cb8548f0087615dd03.txt&portalUrl=https://www.arcgis.com
Infographic
This case study is also posted by Esri: https://storymaps.arcgis.com/stories/08e0c6be6d4848e89a741dcdffba840d