At Sidwell, we understand the power of clear and concise maps, but what truly unlocks your organization’s most vital data? That’s where Esri ArcGIS Dashboards become an invaluable tool for fully leveraging your Esri implementation. These powerful dashboards transform complex information into accessible visualizations, offering compelling Esri dashboard examples useful across diverse municipal and county departments.
- Assessor’s office – Dashboards are a key way to track appraiser workload, the number of appeals, valuation statistics, real estate sales, permits and more
- Economic development – Dashboards can show numbers and types of businesses in target areas such as incentive zones; the success of community development programs; or even delinquent properties that could be identified for redevelopment projects
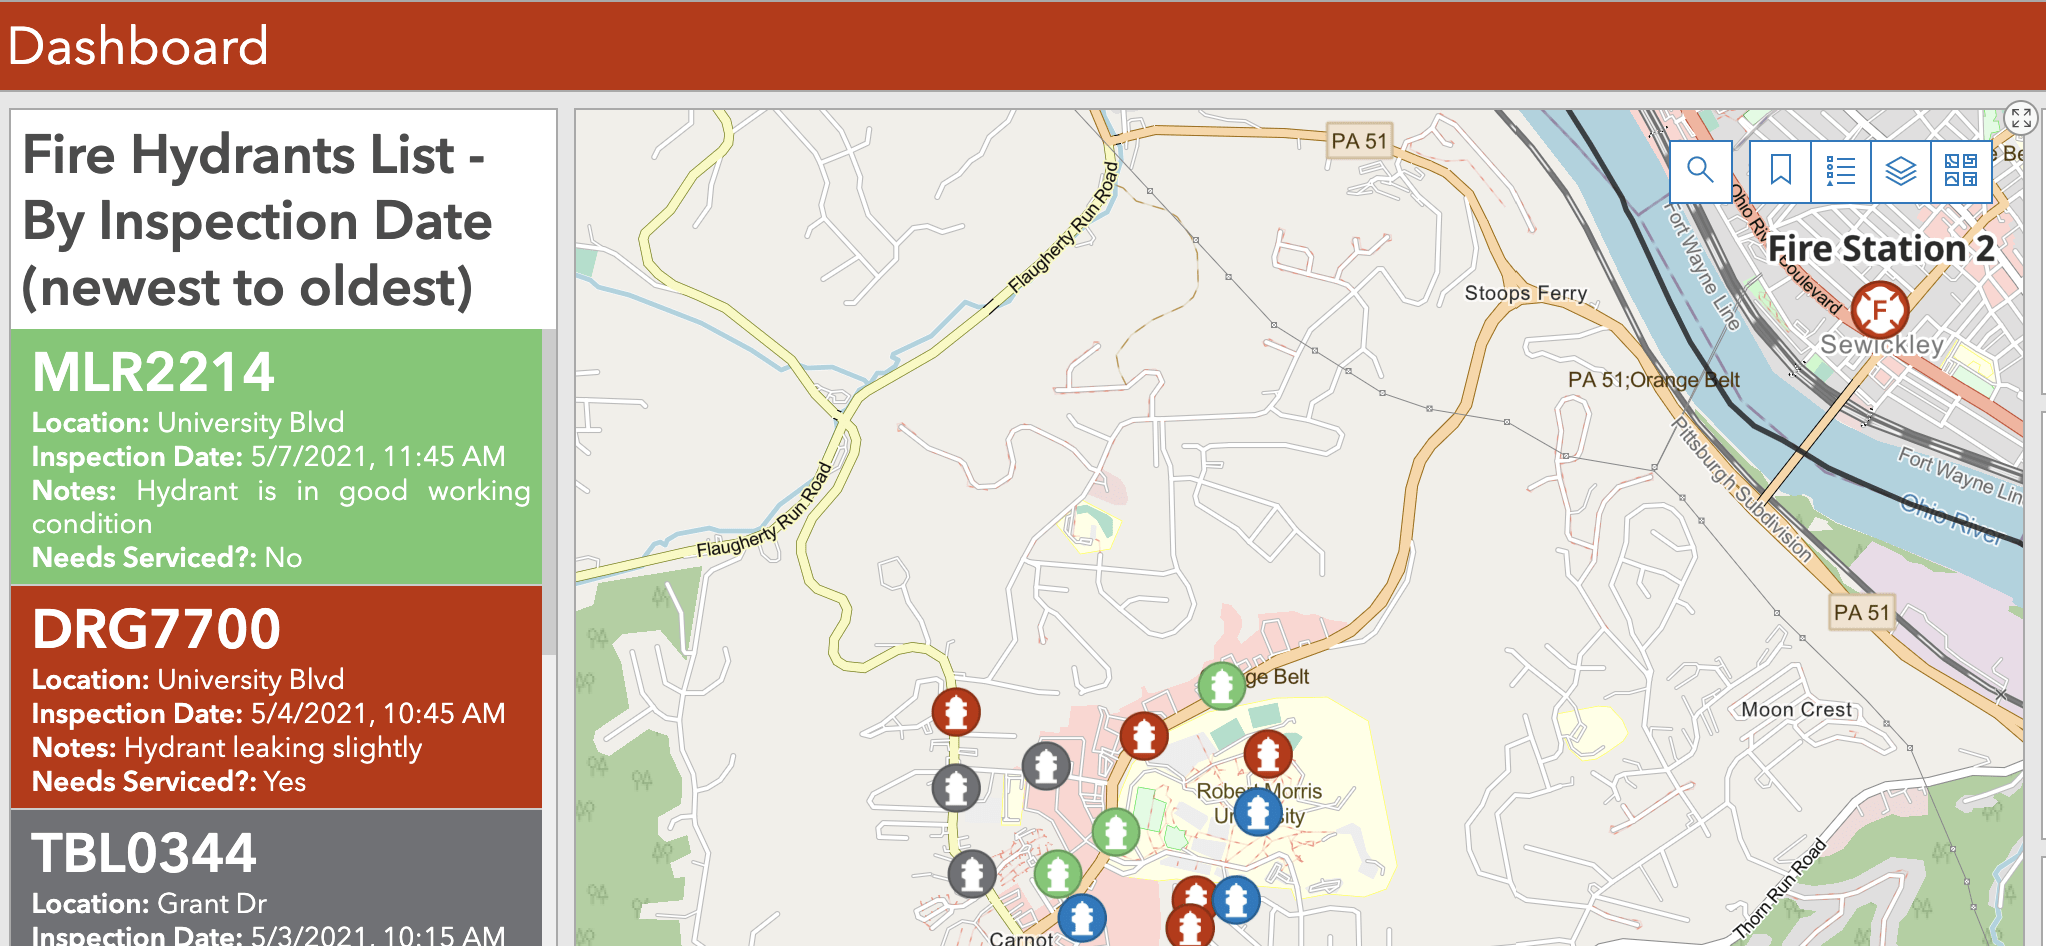
- Emergency management – Like the fire hydrant dashboard created by Sidwell (shown below), such at-a-glance information can provide asset management capabilities; management of field surveys such as damage assessments; and public engagement applications such as the dashboard build by Johns Hopkins for coronavirus
The possibilities for dashboards across these and other disciplines is innumerable. We would love to work with your organization here at Sidwell to create easy-to-use, engaging and dynamic dashboards to put your organization in the driver’s seat of the data that’s most important to you. Contact us to get started.